
Eddy Current Instrument for Tube Inspection
ETi-300/350
User Manual
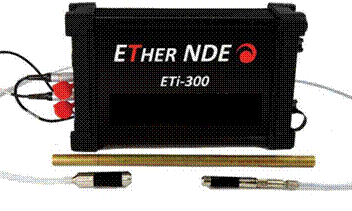 |
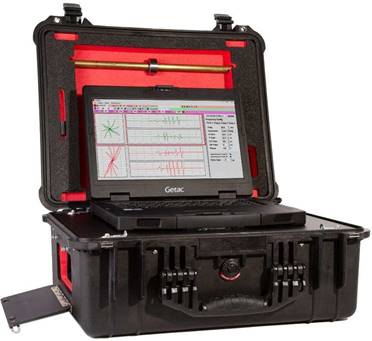 |
||

Eddy Current Instrument for Tube Inspection
ETi-300/350
User Manual
 |
 |
||
ETher NDE Ltd.
Endeavour House, Unit 18, Brick Knoll Park,
Ashley Road, St Albans, Hertfordshire, AL1 5UG.
Tel: +44 (0) 1727 648050
The ETi-300 is a headless Eddy Current Tube Inspection Instrument, now joined by its counterpart the ETi-350, which comes supplied with an inbuilt but removeable laptop - Both operate with the ETherMap acquisition and analysis software and the optional TMR tube mapping and reporting software.
The ETi-300/350 is an eddy current tube testing instrument for inspecting non-ferrous tubing from the inner diameter (ID), developed by ETher NDE to perform in the most demanding of environments whilst delivering outstanding inspection results and reporting functionality. Eddy Current testing has long been acknowledged as the fastest, most efficient, and effective inspection method to inspect the large quantity of non- ferrous tubes present in a typical heat exchanger. The ETi-300/350 instrument, and the suite of analysis and reporting software is ideal for heat exchanger and condenser inspection applications within Power Generation, Transportation, Petrochemical and Oil and Gas industries.
Outstanding Performance
The extremely wide test frequency range 10Hz-12.8 MHz giving maximum flexibility in designing a test configuration no matter what the material or wall thickness.
Our hardware is well known for having the very best signal to noise ratio, widest balance range and low frequency performance all leading to improved defect detection.
The fully configurable and automatic mixing system ensures that the optimum setup is easy to achieve.
The constant sample rate of 16,000 samples per second, over all channels, ensures very high maximum probe pull back speed. Digital data transfer to the Analysis PC via the full speed USB 2.0 ensures consistent and accurate signal quality.
The battery system delivers 15 hrs of battery life, only requiring a 2.5 hrs charge to replenish (a short 1hr charge gives 6hrs additional battery life).
The ETi-300/350 has been designed for the typically demanding tube testing environment we know our customer’s experience. Starting with the sealed and fan-less unit, rated to IP66, which prevents dust and water ingress leading to improved reliability and reduced replacement
costs. Constructed with a heavy duty cast and extruded aluminium enclosure with silicone elastomer corner protectors that will ensure protection from the knocks and drops associated with the harsh environment that our customers expect the ETi-300/350 to perform in. However, the ruggedness does not come at the cost of increased weight (2.8kg/6.2lb) or size (214x90x342mm – 8.5x3.6x13.5ins). The latter is about the size of 2 packs of 500 sheet photocopier paper but half the weight.
Note-1 Always refer to the applicable inspection and operator certification procedures and national and international standards before undertaking a test particularly those referring to certification of operators.
Note-2 The User Manual of the ETher NDE ETi-300/350 eddy current tube inspection instrument (referred to as the "instrument") is intended to explain the operation principles of the instrument.
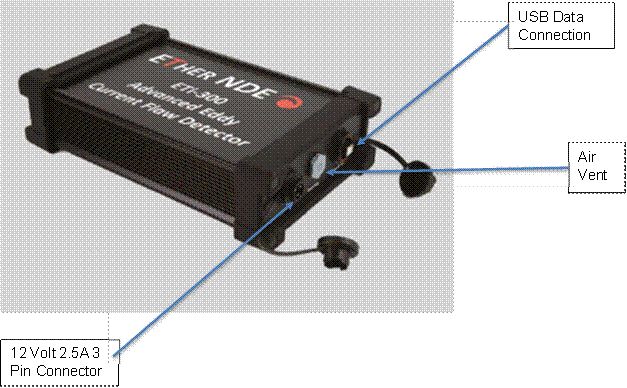
This section gives an overview of the various external features of the instrument.
Fig. 1– ETi-300/350 Front Panel
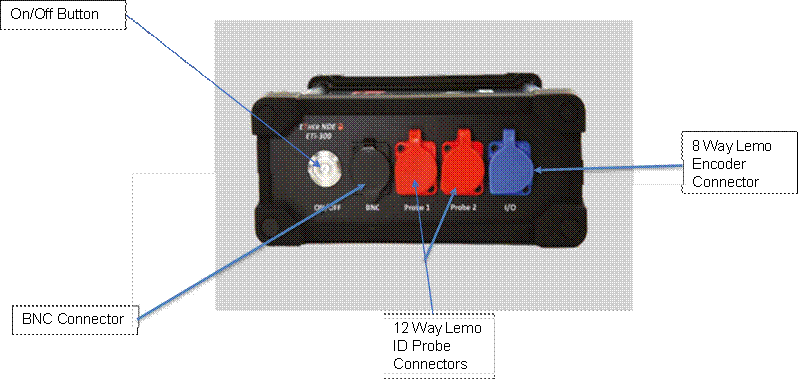 |
Fig. 2– ETi-300/350 Rear Panel
 |
|
KIETI300 |
KIT, ETi-300 - Advanced Eddy Current Tube Inspection Flaw Detector, 2 Probe Input. Including: |
|
IETI300 |
Instrument, ETi-300 - Two Probe Input - No Display - Eddy Current Flaw Detector |
|
C315 |
Accessory, BULGIN, USB 2.0, Male USBB to Male A, 3m USB CABLE, IP68 |
|
AETI003 |
Accessory, ETi-300, Mains Power Supply (Mains Plug Sold Separately) |
|
AMXXX |
ACCESSORY, MAINS LEAD, 2m, Class 1 Triangular Connector, (Per Country of Destination) |
|
AC018 |
Accessory, Hard Carry Case, Eti-300 |
|
60106 |
Software, ETher Map |
|
60109 |
Software, ETi-300 USB Stick Image |
|
AAL12- Z04SB |
Accessory, Adapter, 12-Way Lemo to 4-Way Amphenol (ETher to ZETEC Bridge Probes) 330mm Long |
|
KATUB001 |
KIT, Tube Inspection (To fit ETi-300/350 |
|
PID138D0018K |
Probe, Internal Diameter, Differential, Dia 13.80, Disconnect, 18k. |
|
CIDL03F |
Accessory, ID Lead,12-Way Lemo, Flexible, 3.0m |
|
ATBTB1587 |
Accessory, Test Block, Tube, Brass, OD 5/8”, (15.87mm) x 20swg, Calibration Tube |
|
ATB010 |
Accessory, Test Block, ID Probe Support Ring-OD 25.4 x ID 16.6 x 20.00mm Long |
|
OPERATING MODES |
EDDY CURRENT MODES |
Eddy Current Single Probe Frequency |
|
Eddy Current Dual Probe Frequency |
||
|
Eddy Current 1 Probe up to 4 Channels (E.g., 3 Frequencies Bridge Differential & 1 Frequency Absolute, or 2 Frequencies Bridge Differential & 2 Frequencies Absolute) |
||
|
Eddy Current 2 Probe up to 2 Channels each (E.g., Dual Probe each with Dual Frequency Bridge Differential |
||
|
PROBE |
CONNECTORS |
12-Way LEMO 2B (Absolute, Bridge, Reflection |
|
12-Way LEMO 2B (Bridge, Reflection) |
||
|
BNC - Absolute |
||
|
Simultaneous Probe Operation Using 2 off LEMO 12-Way |
||
|
|
|
|
|
FREQUENCY |
MULTI FREQUENCY |
10Hz – 12.8MHz (No Limit on Frequency, All Channels) |
|
GAIN |
OVERALL |
-18 to + 104dB, 0.1, 1 & 6 Steps |
|
INPUT |
0dB Or 12dB |
|
|
DRIVE |
0dB, 6dB & 10dB (0dB Reference 1mW Into 5- Ohm) |
|
|
MAX X/Y RATIO |
+/- 100.0 dB |
|
|
PHASE |
RANGE |
0.0-359.9°, 0.1 Steps |
|
FILTERS |
SAMPLE RATE |
Constant 16KHz Overall Over 4 Times X/Y Pairs |
|
HIGH PASS |
DC to 2kHz or Low Pass Filter, Which Ever Is Lower in 1 Hz Steps. Plus, Variable Adaptive Balance Drift Compensation 0.01 – 0.5Hz (6 Steps) |
|
|
LOW PASS |
1Hz to 4kHz or a Quarter of The Lowest Test Frequency, Which Ever is Lower in 1Hz Steps |
|
|
BALANCE LOAD |
MANUAL |
14 Internal Balance Loads; 2.2µH, 6.0µH, 7.0µH, 8.2µH, 12µH, 15µH, 18µH, 22µH, 30µH, 47µH, 82µH, 330µH, 820µH, & 3,300µH, |
|
AUTOMATIC |
Optimised Balanced Load Selection |
|
|
MIXED CHANNEL |
FREQUENCY |
Full Frequency Range Available on all Channels |
|
NUMBER OF MIXERS |
8 Maximum User Definable Configuration |
|
|
OPERATIONS |
Automatic or Manual |
|
|
MIX GAIN |
X/Y -18 to +18dB |
|
|
MIX PHASE |
0.0-359.9°, 0.1° Steps |
ETi-300-350 Specification Continued
|
CONNECTIVITY |
USB |
Full Speed USB 2.O 12.5 MB/s |
|
|
I/O |
8-Way LEMO 4 Configurable TTL Level With 5V EG Encoder Input |
||
|
POWER |
EXTERNAL |
100-240V, 50 to 60Hz, 30-Watts |
|
|
BATTERY |
Internal 7.2V Nominal @ 6200mAh = 44.46 Watt.hr |
||
|
RUNNING TIME |
Up to 15 Hours with a 18kHz ID Probe |
||
|
CHARGING TIME |
2.5 Hours Charging Time, Simultaneous Charge & Operation |
||
|
POWER ON SELF- TEST |
The System Performs a Self-Test on Start-Up |
||
|
PHYSICAL |
WEIGHT INCLUDING INTERNAL BATTERY |
2.8Kg (6.17Lbs) |
|
|
SIZE (W X H X D) |
214 X 90 X 342mm (8.5 X 3.6 X 13.5 Inches) |
||
|
MATERIAL |
High-Impact Resistant Aluminium Enclosure, with Tough Silicon Elastomer Edge Protection |
||
|
OPERATING TEMPERATURE |
-20 to +60°C (-5 to 140°F) |
||
|
STORGAE TEMPERATURE |
Storage for up to 12 months -20 to +35°C (-5 to 95°F). Nominal +20°C (68°F) |
||
|
IP RATING |
IP66 |
||
|
VERIFICATION LEVEL |
The System Includes on Delivery a 2 Year Validity Verification Level 2, Detailed Function Check & Calibration as per ISO 15548-1:2013 |
||
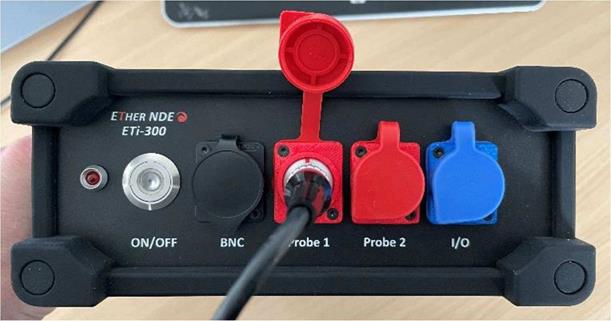
Unscrew x2 dust caps on back of instrument, plug supplied power supply and USB lead into ETi-300 instrument, plug free USB end into PC, plug ID probe into Probe 1 socket. (Please note that the ETi-300 can be run from its internal battery instead of plugging in power supply):
 |
Picture Below Shows Power and USB Connected:
 |
Picture Below Shows Probe Connected to 12 Way Lemo Connector on Front Panel of the Instrument:
 |
Picture Showing Full Assembly of Power from Mains Supply, Data Connection via USB, from Instrument to PC, & Probe Connection into Probe Port 1 of Instrument:
EtherMap is the latest PC software offering from Ether NDE and has many uses within the realm of Ether NDE and Eddy Current inspection. EtherMap:
· Is the interface to the ETi-300 and is used to configure the hardware and to receive data Eddy Current data from it.
· Will connect to Ether NDE’s AeroCheck range of Phase Plane instruments and can retrieve both live and saved data from them.
· Will connect to Ether NDE’s SteelCheck MFL (Magnetic Flux Leakage) instrument and can retrieve both live and saved data from it.
· Will open and display data files in *.etd (Ether Data) format that have been created with any of our phase plane instrument range as well as the SteelCheck.
· Will display data in a way that is consistent with the industry norm to allow data from a tube inspection to be analysed.
· Will allow tube inspection data to be manually and automatically analysed for defects.
· Will maintain a list of tubes inspected and defects found. This data can be exported in various formats including Microsoft Excel.
EtherMap is most useful for inspecting tubes when used as part of Ether NDE’s end-to-end tube inspection suite, TMR. When used in this way, EtherMap:
· Takes the Tube Map generated by TMR and allows the operator to associate data with a specific tube.
· Outputs the data in a format that is understood by TMR Reporting, which can quickly and simply generate all required reports.
 Load ETherMap Software
onto PC
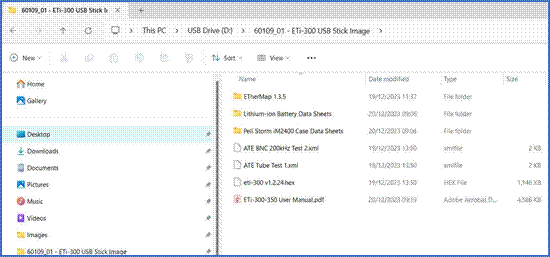
Plug supplied USB stick into PC, the following files should be found, please note software and, (.hex) version number could be different:
Open ETherMap folder, double click on ETherMap windows Installer:
|
|
|
 |
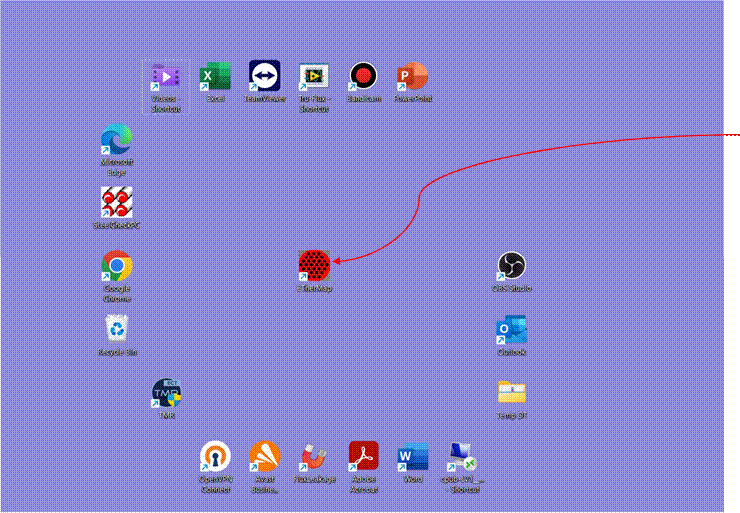
The software should now be installed and the ETherMap icon shown on your desktop:
 |
If your PC/Laptop is operating on Widows 11 and after you have loaded the EtherMap software for the first time, it is necessary to change administrator privileges. To do this follow the instruction below:
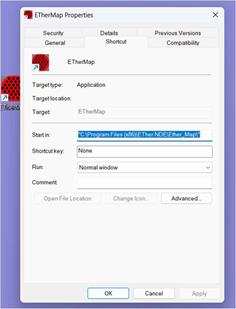 |
Go to the location where the EtherMap software is stored. If you are not sure where it is stored, right click on the EtherMap icon on your desktop and then click on properties.
You will find the file path, for the EtherMap software folder, within the Shortcut tab and highlighted in blue as per the image above.
Once you have navigated to the EtherMap Software installation folder e.g., C\Program Files (x86) EtherNDE\_Map\, right click on the EtherMap Application file.
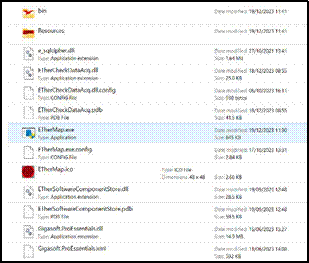
N.B. You may find that the EtherMap application file is shown without the file extension i.e., (.exe)
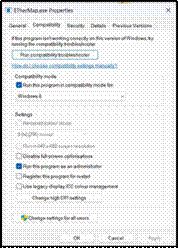
From the drop-down menu, select Properties and within the Compatibility tab, make sure the following items are checked.
Compatibility Mode: Run this program in compatibility mode for Windows 8. & Settings: Run this program as an administrator.
Failing to have these 2 items checked, will result in some of our third-party software controls not working, and therefore data will not be visible.
Once you have checked both items click on OK
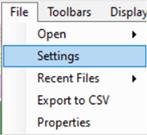
Click on the EtherMap short-cut Icon on your desktop and once the software has opened select File and then Settings, which is at the top left- hand side of your screen.
 |
When you click on settings you will see the following window:
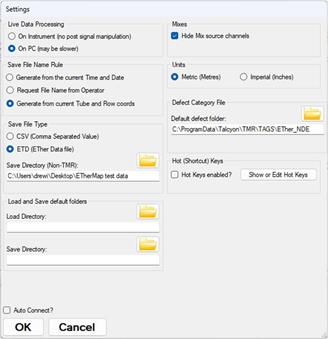
If you are using the TMR software the default defect folder should be populated with the following file path:
C:\ProgramData\Talcyon\TMR\TAGS\Ether_NDE
If the TMR software has not been installed onto your PC/laptop then you must create a folder at a location and title of your choice.
For ease of use, we recommend that all Defect Category Editor Database files (TAG Files) that you create and are using should be filed within the TMR default folder or the folder that you have created.
For details on the Defect Category Editor please go to Page 37.
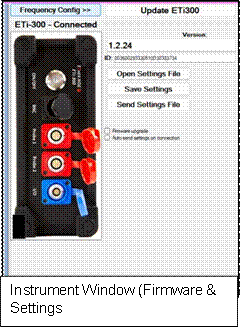
When the ETi-300 tool bar button is clicked or EtherMap detects that it has been connected to an ETi-300, the ETi-300 Side Window will open.
Connected or Not Connected is displayed across the top of the window. If this window was opened automatically on connection of an Eti-300 then ETherMap may behave differently depending on various options held within this window. There is the option to upgrade the firmware and to automatically transmit settings to the instrument. The ETi-300 does not save any of its own settings and must be configured each time it is powered on, thankfully this can be set to happen automatically on connection. If the Auto-Send Settings on connection checkbox on the ETi- 300 side-window was checked then the ETi-300 settings will be updated to match that of ETherMap.
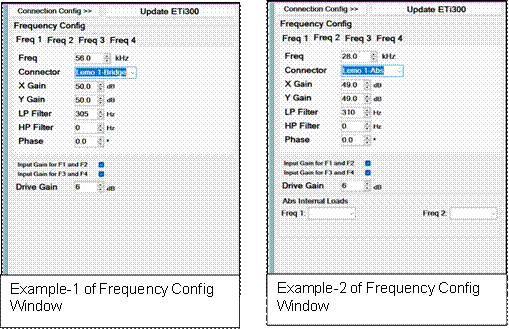
As shown and explained below, there are 2 windows that make up the ETi-300 configuration. The values of these windows are saved when ETherMap is closed.
Clicking on Frequency Config>> or Connection Config>> will toggle between 2 available windows.
 |
 |
||
Some basic (but important) information regarding the connected hardware is shown here, firmware version and the unique ID. The battery level is indicated in the bottom left corner of the ETi-300 image.
Check this box when a firmware upgrade is required. This must be checked before the ETi-300 is connected to ETherMap, or the ETi-300 can simply be powered off and on once this box is checked.
When the ETi-300 is connected and this box is already checked, the user will be prompted for the new HEX file. When the file is selected, it will be loaded on to the instrument, this will take approximately 1 minute.
The Eti-300 can provide 4 independent frequencies spread over one or 2 physical probes. Each frequency has a dedicated tab as can be seen in the above screen shot. The parameters associated with this frequency are all shown and are independent between each frequency (except Input Gain where there is one for Frequency 1 &2 and another for frequencies 3&4).
All frequencies can be connected to LEMO1; LEMO2 can only use frequencies 3 & 4.
The Connector drop-down specifies where the physical signal frequency will be transmitted, LEMO1 or LEMO2, it also specifies the type of probe, Absolute, Reflection or Bridge. If Absolute is selected, then an associated load must be selected from the lower Abs Internal Loads section. In the above example screen shot frequencies 1 and 4 are set to Absolute hence the visible dropdowns for those frequencies.
Any parameters that are modified on the Frequency Config tab are NOT automatically sent to the connected instrument then the Update button must be clicked.
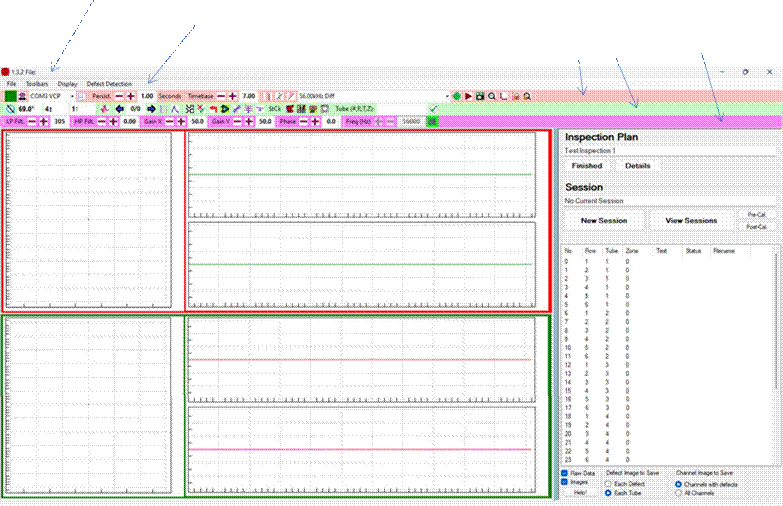 A quick guide to the
various buttons and screen areas of ETherMap. In the Title Bar of
ETherMap is the version number of the application.
Below that is the Menu Strip.
Below the Menu Strip we have the 3 Toolbars. Main, Analysis & Instrument Settings
Description of the Menu Button Content from Left to Right:
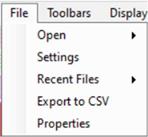
File Menu
 |
 |
||
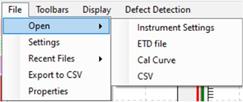
File/Open
 |
 |
||
File/Open/Instrument Settings
 |
 |
||
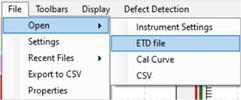
File/Open/ETD file
 |
 |
||
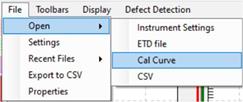
File/Open/Cal Curve
 |
 |
||
File/Open/CSV
 |
 |
||
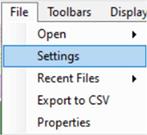
 File/Settings
 |
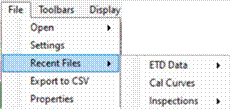
 File/Recent Files
 |
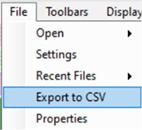
File/Export to CSV
 |
 |
||
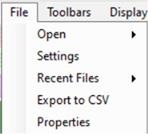
 File/Properties
 |
 Toolbars Menu
 |
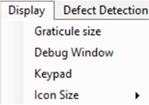
 Display Menu
 |

N.B. For a more detailed description of the Defect Category Editor, please see Page 37.
|
Live & Analysis Button- Start/Stop live data |
|
Record/Save Live Data |
|
|
Connect/Disconnect |
|
Pause/Play Live Data |
|
|
|
|
Stream Data to File |
|
|
Opens the Pane Layout |
|
Cancel Zoom |
|
|
Change the Persistence of a Phase Plane |
|
***All Panes Scroll & Zoom Together |
|
|
Change the Timebase of the Strip Chart Window |
|
|
|
|
*Toggle the Mouse Click on a Timebase Window, Moving the PINK Persistence Strip |
|
|
|
|
*Toggle the Mouse Click on a Timebase Window, Moving the Dotted Cursors |
|
****Cursors Independent Between Graphs |
|
|
**Toggle the Dotted Cursors being Displayed |
|
*****Zoom Locked Mouse will Scroll |
|
|
|
|
|
|
|
The Current Channel being Displayed is Highlighted |
|
|
|
N.B. For a detailed description of the Panes Layout, see Page 33.
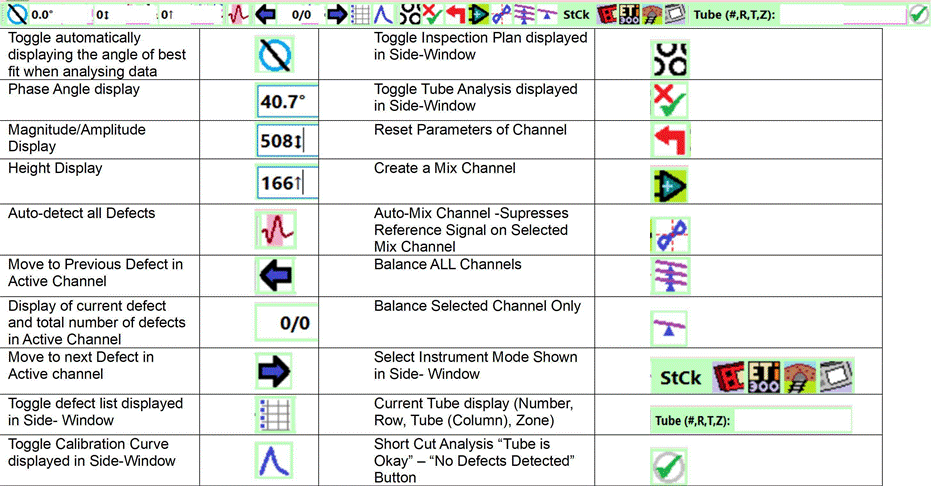 Description of the Buttons from Left to Right:
|
Toggle automatically displaying the angle of best fit when analysing data |
|
Toggle Inspection Plan displayed in Side-Window |
|
|
Phase Angle display |
|
Toggle Tube Analysis displayed in Side-Window |
|
|
Magnitude/Amplitude Display |
|
Reset Parameters of Channel |
|
|
Height Display |
|
Create a Mix Channel |
|
|
Auto-detect all Defects |
|
Auto-Mix Channel -Supresses Reference Signal on Selected Mix Channel |
|
|
Move to Previous Defect in Active Channel |
|
Balance ALL Channels |
|
|
Display of current defect and total number of defects in Active Channel |
|
Balance Selected Channel Only |
|
|
Move to next Defect in Active channel |
|
Select Instrument Mode Shown in Side- Window |
|
|
Toggle defect list displayed in Side- Window |
|
Current Tube display (Number, Row, Tube (Column), Zone) |
|
|
Toggle Calibration Curve displayed in Side-Window |
|
Short Cut Analysis “Tube is Okay” – “No Defects Detected” Button |
|
Description of Buttons from Left to Right:
![]()
|
Low Pass Filter Controls (Increase, Current Value, Decrease) |
|
Phase Controls (Increase, Current Value, Decrease) |
|
|
High Pass Filter Controls (Increase, Current Value, Decrease) |
|
Frequency Controls (Increase, Current Value, Decrease) |
|
|
Gain for X Component Controls (Increase, Current Value, Decrease) |
|
Toggle Gain XY Locked, Phase Maintained, On/Off Button |
On Off |
|
Gain for Y Component Controls (Increase, Current Value, Decrease) |
|
|
|
![]() The Pane Layout button opens the Layouts window:
The Pane Layout button opens the Layouts window:
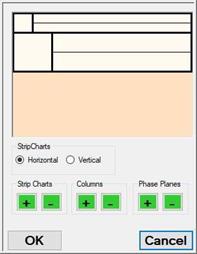
The Strip Chart portion of each window can be shown horizontally or vertically.
The number of Phase Planes and Strip Charts can be individually increased and decreased with the use of the
+ and – buttons.
In the Horizontal orientation, windows can be arranged in Columns to make better use of the screen size, the number of these columns can be increased and decreased also.
The main area of the Layouts window gives an indication as to what the main application widow will look like.
In horizontal orientation the upper strip chart shows the X component of the EC signal with the lower strip showing the Y component. Any data that is highlighted by the pink Persistence area is displayed within the phase plane area of the window. The LEFT mouse button will either move the pink Persistence area, or it will move the green dotted cursor. The cursor icon toggles which cursor is moved by the mouse click:
Four Examples of different layouts are illustrated below.
 |
3 x Vertical Phase Plane Layout 3 x Horizontal Phase Plane Layout 5 x Vertical Strip Chart Layout 5 x Horizontal Strip Chart Layout
Here we assume that the correct Serial Com port drivers have been installed, these are the same as used by existing ETher Phase Plane instruments. When an ETi-300 is connected to the host PC the active Com port should be displayed in the Com Port drop-down (if not, it can be manually selected). If the Auto Connect setting is selected then ETherMap will connect to the ETi-300, if not, simply click the Connect button from the toolbar. If successful, then the Connect icon will change to represent a plug and socket that are connected.
Using the Frequency Config window of the ETi-300 Side Window, ensure that the instrument is correctly configured to use its connected probe. See the section Streaming Eddy Current Data below.
Once connected and configured to the respective instrument, data can be streamed quickly and easily, simply click the large GREEN square button to start streaming data. The button will then change colour to RED to indicate that another click would stop live data streaming.
To see data then there must be at least one window visible in the Data Display area of ETherMap. This window must also be set to one of the available channels; the channels can be seen and selected with the Channel drop-down box in the main toolbar. If no data is visible, try clicking the BALANCE button. From here, assuming that the probe is correctly configured and connected, live data should now be visible. Now it’s a case of configuring how the data is displayed in a manner consistent with the operator’s preference.
The Strip Charts of each display show a specified amount of data based on TIME, i.e., 5s from start to finish. This can be configured using the Timebase setting in the main toolbar. With a value of for example 10 seconds, most data from a whole tube would be visible. With a value down as low as 0.5s quickly changing data is visible.
The Phase Plane part of the display has its own time setting which is called Persist. in the main toolbar. The Phase Plane is often used in tube testing to see how the phase changes between defects (especially on a calibration Tube); therefore, it may be useful to have the Phase Plane set to something in the region of 0.5s but have the Timebase of the Strip Charts set to a long 5s so that the overall inspection is visible.
The live data stream can now be fine-tuned by use of the Filters, Gains, Phase and Frequency settings within the tool bar.
At some point we need to now stop or save the live data to analyse it. The simplest method of doing this is to just click the RED square which will stop the live data stream and allow analysis of the data that is currently visible on the screen.
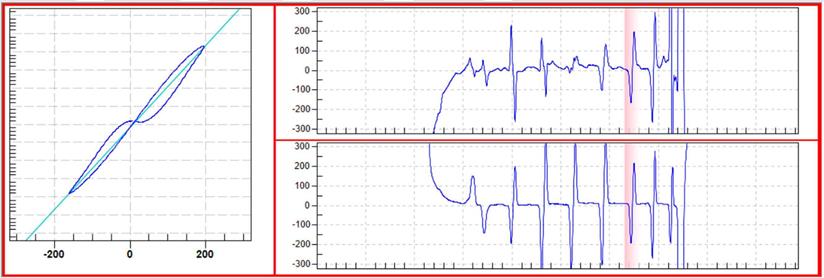
There are two displays that can added to the main Display Windows, both include a Phase Plane and 2 strip charts, but the focus is different:
1.
 |
2. Phase Plane
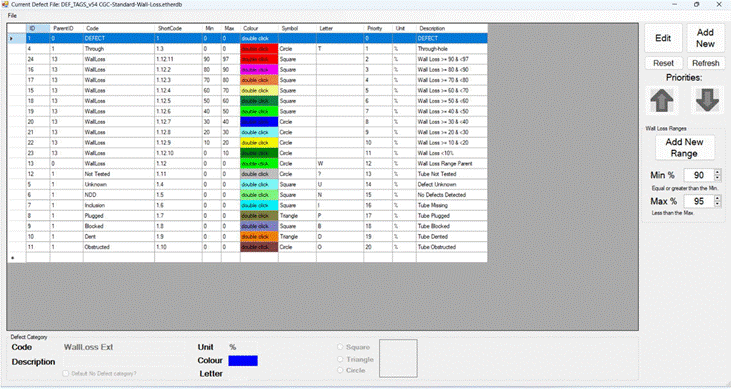 |
The Defect Category Editor has been designed to allow users to add and delete categories, to change the colour and symbol of defect categories to existing Defect Category Database files (etherdb) and to create new etherdb files.
If EtherMap is being operated without the TMR software, then a folder can be created to store the etherdb files and the folder can be located wherever the operator deems suitable. If the EtherMap & TMR software are being used together, then a shared folder, i.e., both the EtherMap and TMR software will share the folder, which will be found via the following file path: Disc (C:) > ProgramData > Talcyon > TMR > EtherNDE.
N.B. The Defect Category used during the inspection project created on EtherMap, will also be used for the TMR report legend.
To assign shortcut keys follow the following steps:
Step-1: Go to the File menu, and click on Settings.
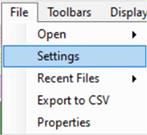 |
Step-2: Check the “Hot Keys enabled?” Button and then click on the “Show or Edit Hot Keys” Button.
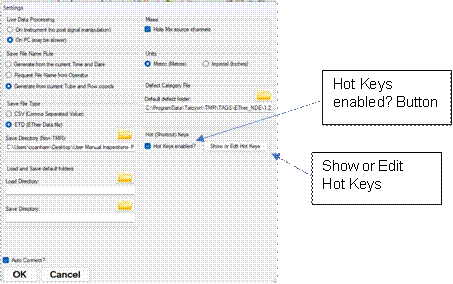 |
Step-3: The Hot Keys window will now appear.
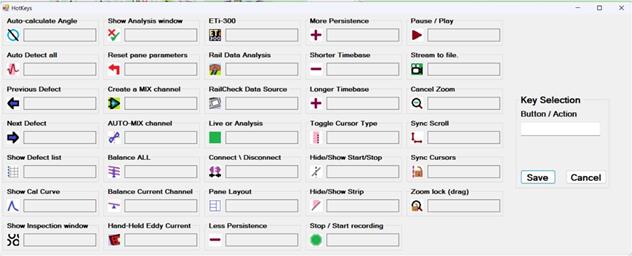 |
Step-4: Click on one of the button options, and the Key Selection will indicate which button has been selected.
 |
Step-5: Overwrite the Key Selection field that says Short-curt with the chosen Short-cut (Hot Key) Letter and Click Save.
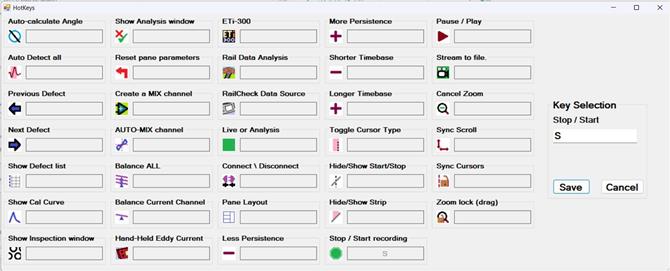 |
 |
||
Step-6: Once all the Short-cut keys have been selected close the window and the keys can be used instead of the mouse control.
N.B. You can edit the Short-cut keys by selecting a Short-cut and change the existing letter. You can not use the same letter more than once.
To Open an existing Inspection Plan or to start a new Inspection Plan, first click on the Show Inspection window Icon on the analysis toolbar.
![]() Show Inspection window icon, found on the analysis toolbar.
Show Inspection window icon, found on the analysis toolbar.
The Inspection plan will then appear in the side window, which is on the right-hand side of your screen. Please see image below for reference.
 |
The Inspection Plan side window can create and view inspection plans and create and view sessions. If there is no current Inspection, then the window will show the NEW and OPEN buttons. Clicking on New will open the following window.
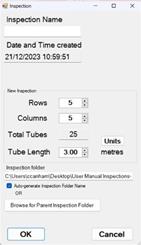 |
If an Inspection is already open, then the Finished and Details buttons will be present.
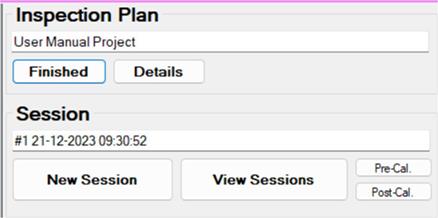 |
Clicking on the Details button will show the Inspection Plan window as per the example below.
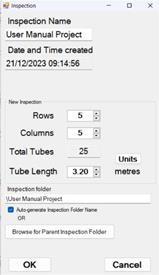 |
To create a new inspection, begin by typing in a name for the Inspection. Note that as you type the name it is automatically appended to the Inspection Folder path if Auto-generate Inspection Folder Name is checked.
The root folder to save inspection data in can be chosen using the Browse for Parent Inspection Folder button.
Inspections created with ETherMap are simple by design and should be considered simply a place holder for one or more individual tube inspections. Simply choose a suitable number of Rows and Columns to cover the tubes of the heat exchanger about to be inspected.
For more detailed Inspection Plans based on real tube sheets use the Talcyon’s’ TMR package. Once the Inspection is created the Inspection Plan window will resemble the screen below.
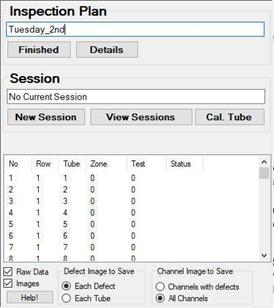
For a detailed explanation on Sessions and how to use them continue to the next section on Creating and Using Sessions.
The list in the centre of the window shows all tubes within the inspection. Each has a unique number, a Row and Tube (Column) coordinate, Zone identifier, Test indicator and finally Status.
Test shows 0 if the tube has NOT been tested and 1 if it has.
Status shows any defect codes that have been assigned to that tube. The default defect codes are taken from the Defect Category file Code
column as explained in the above section Defect Category Editor. A basic example may use Status/Codes as per the following:
I ="Inside"
O ="Outside"
T ="Through"
U ="Unknown" K ="Ok"
M ="Missing" P ="Plugged" B ="Blocked" D ="Dent"
C ="Can't test" N ="Not Tested”
Below the Tube table are several options that dictate what data is saved with each tube that is inspected. All data is saved in the relevant Session folder within the Inspection folder:
Raw Data The raw Eddy Current data file is saved. This can be reanalysed in future.
Images An image is saved into the folder. What images are saved is specified by the following options:
Defect Image to Save If more than 1 defect is identified in a single tube, do we save an image for each defect (Each Defect) or one image containing all the defects within the Tube (Each Tube).
Channel Image to Save There will often be more than 1 channel of Eddy Current data for a single inspection. Do we save the above images for ALL channels (All Channels) or just the channels where the defects were detected (Channels with defects)?
Help! This button will display text that will explain the above options.
Once an inspection is created or opened, all data will be associated with that Inspection and therefore Sessions will need to be created. A Session holds all the traceable information associated with all data that is created while that Session is active. If any details within the Session change, a new Session is created. For example, at the start of an Inspection a session is created that contains the Operator and a calibration file. All data is associated to a Session. If after an hour the test procedure calls for a new Calibration, then a new Session maybe created. If after the midday break a new operator takes over, a new session maybe created.
The Date/Time and Session number are automatically generated. All other fields are optional with the users test procedure identifying what information they require. Each time a NEW Session is created, the Probe Serial, Operator, Tube Material, Tube Diameter and Wall Thickness are automatically carried forward from the previous Session. It is the user’s responsibility to change any required data. The Notes and Calibration Files are NOT carried forward and, if required, should be unique.
View Sessions opens the same window, but all data is read-only. There is an UP and DOWN button, so that all Sessions can be scrolled through and viewed.
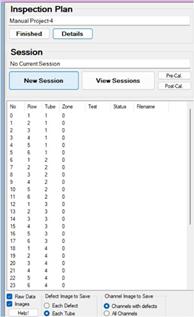
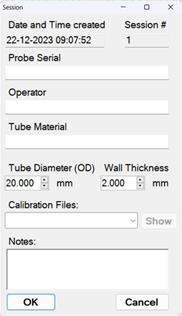
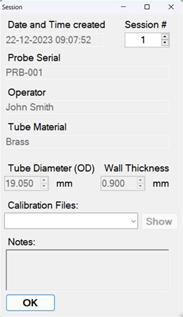
Click on New Session A session window will appear If required, fill in details accordingly
“Pre Cal. & Post Cal.” Should be used to save the signal data in the ETherMap phase plane & strip chart displays from a calibration tube. This will be assigned to the current Session. This saves images and raw data to the Session folder.
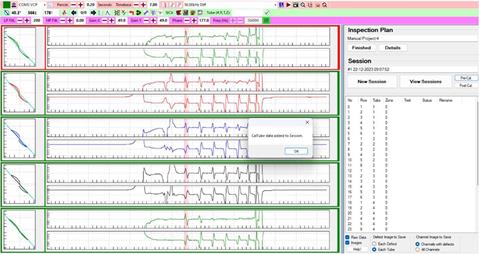
Once the pre calibration button has been clicked, the images of the associated calibration will be stored within the Session data file. To view this through the EtherMap software interface, click on View Session and the Session window will open. To see what calibration image files have been saved click on the Calibration Files’ dropdown arrow and the image file names will appear.
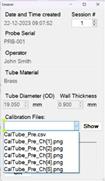 Click on Calibration Files’ dropdown arrow and the calibration file
information will be displayed.
A Calibration curve is created from a tube with known defects of a known size. These sizes of these defects are used to create a look up curve. Once this curve has been created it can be sued to automatically size defects found in tubes under inspection. Tubes under inspection generally must be of the same material and size as the calibration tube used to create the curve.
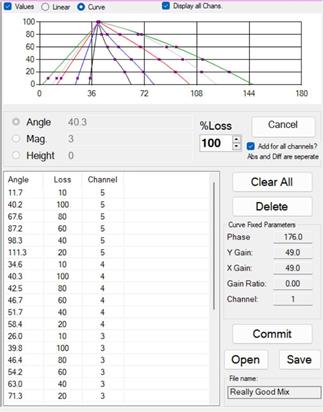
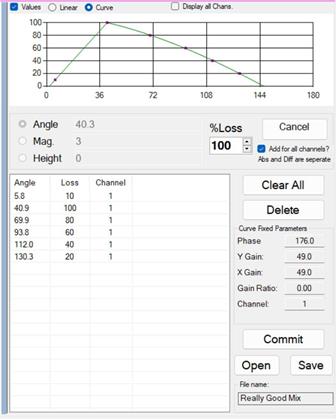
The Calibration Curve Window:
 |
|||
 |
|||
In Eddy Current it is usually the Phase Angle of a defect that is proportional to the defect size, but with other technologies this is not always the case. This is where the top row of buttons come in, select the variable that the Calibration Curve should be based on, Angle, Height, or
Magnitude. Each channel of the data from an instrument can be used to create a different Cal Curve and each one can also use a different parameter (Angle, Magnitude, Height) as the basis of its curve.
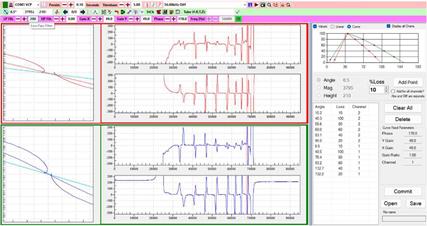
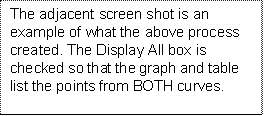
When a different channel is highlighted in the main Data Display Area of ETherMap, any Calibration Curve based on that data will be displayed on the Cal Curve window graph. If the Display All box is checked, then all channel graphs will be displayed at once. Bear in mind that if the graphs of different channels use widely different axis values, then the data may look eccentric.
The Angle, Mag. And Height boxes display the same data as the respective text boxes on the Analysis tool bar on the main application. These values are updated as the user moves the pink Persistence strip around a Strip Chart. The %Loss value must be entered by the user when creating a Cal Curve point, it refers to the known loss of the highlighted defect from a Calibration Tube. The button Add New Point uses the %Loss along with the relevant Angle, Mag, or Height value to create the data point. The new data point is added to the list of points for the current channel and the graph is updated. See Creating a Calibration Curve.
The table in the Calibration Curve window shows the created data points for the current channel or the points for ALL channels if the Display All box is checked. The Clear All button does exactly that, clears all points from the table so that a new curve can be created. Delete will delete a single highlighted entry in the table.
Open and Save allow a Calibration Curve to be saved or restored.
The data in the Curve Parameters area shows the values of Phase, X Gain, Y Gain, the Gain Ratio, and the Channel. These are the values of those parameters at the time of creating the Calibration Curve. If these values change between creating the curve and inspecting a tube, then the curve may not give correct values. For example, changing the X or Y gain will change the Phase angle, but if the Ratio is the same then all is well. If the curve is using the signal Height for a Calibration curve, then changing the X Gain will have no effect but the Y Gain must not be changed. The Channel value is purely indicating which channel of data is currently being analysed by the highlighted window in the Data Display area of the main application.
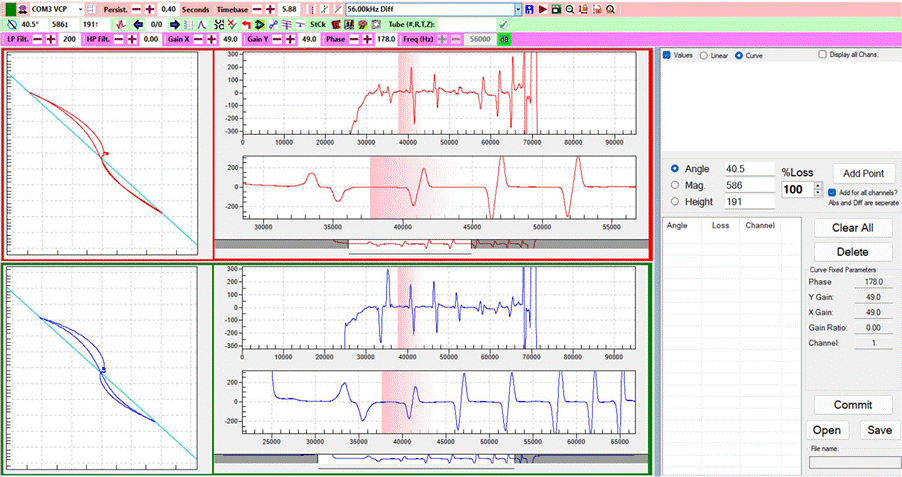
Here is an example of creating a calibration curve using 2 channel Eddy Current data. The screen shot below shows the Data Display area of ETherMap. There 2 visible channels are 56kHz and kHz. To improve the readability of the data I have zoomed in on the Y component of each channel but not the X. To do this you can use the wheel on your mouse device to zoom in and out of the selected X or Y component. After setting individual zoom levels click the Lock Cursors and Lock Zoom buttons on the main toolbar, this will ensure that when a defect is selected in one channel the same section is also highlighted on the others. In the screen shot below the 2nd obvious defect is selected, this is the 100% through-hole on the calibration tube. The width of the pink Persistence strip should be large enough to cover the defect but not to include any data of any adjacent defects, this can be changed using the + and – Persist. buttons. At the top left of the screen shot the angle is display as
40.5 degrees, for most procedures this should be set at 40 or 45 degrees, so using the Phase control to the right of the bright pink toolbar, we can adjust the angle until the measured angle is 40 or 45 degrees. Repeat this for the 2nd channel also.
 |
Now follow these steps to create the calibration curve:
1. Highlight a chart that you want to work from. The window will have a red border as in the above screen shot).
2. On the Cal Curve window select Cal. Ang, and to create calibration curves, simultaneously, for all channels that are in use ensure make sure the “Add for all channels” box is checked.
3. Make sure the Pink Persistence bar is over the 100% Through Wall Hole (TWH) and check that the %Loss is set to 100 and click Add New Point. If this is not the case, then adjust accordingly.
4. Move the Pink Persistence bar over the 80% Flat Bottom Hole (FBH) making sure you are not picking up any signal data from any adjacent simulated defects i.e. the TWH and the 60% FBH, change the value from 100 to 80 in the %Loss and click Add New Point.
5. Repeat above for all other simulated defects that you are going to use to create the sizing curves. (A standard ASME curve will have a 100% TWH, 80%, 60%, 40% and 20% OD FBHs and a 10% ID FBH).
6. You can display each curve individually by clicking on the associated chart or you can check the box that says Show all channels and that will show all curves that have just been created.
7. If any of the curves need adjusting adjust the phase angle accordingly at the points you want to adjust from and once completed, you have the option to Save the curve and to Commit. Once you have clicked on the Commit button the sizing curves selected will be available to be used to calculate wall loss when analysing tube signal data.
The Cal Curve is now complete!
 |
 |
||
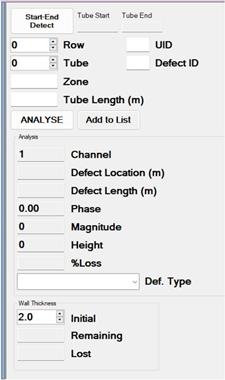
This window is the main Defect Logging part of ETherMap, although not the only (a basic defect can be added with the mouse right-click on a Strip chart).
The details on this window are those that are stored in the Defect List window and then made available outside of EtherMap, except the Wall Thickness section which is a simple calculation of what the remaining wall thickness would be given the % loss. Most of the values within this window are auto populated, see the information below on each parameter.
 |
Tube Start & Tube End are the sample numbers of where the start and end of the tube lies within the data, if data recording began before the probe entered the tube and continued afterwards. The Start point is identified with the left mouse button (or Green) dotted cursor. The Stop point is identified with the right mouse button (or Red) dotted cursor. Remember, use the tool bar button “Toggle between the mouse click” button to change between the mouse click moving the Persistence area and the dotted cursors:
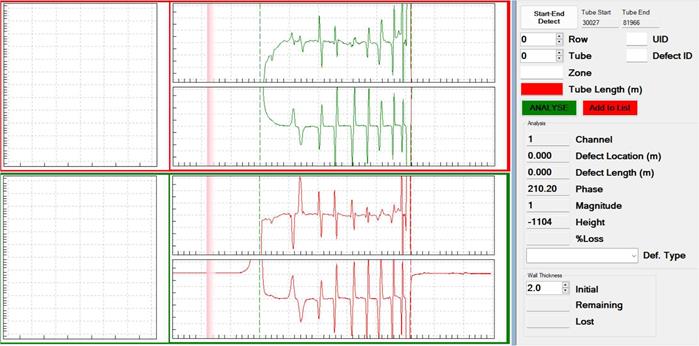 |
These locations are usually obvious in the data as there would usually be a large spike as the probe enters or leaves the tube. If the probe didn’t enter or leave the tube during data capture, then the start or end of the data can be used. This data is to enable the location of defects to be estimated without an encoder and is not compulsory. For reference, please see Image above showing start (Green) dotted cursor and end (Red) dotted cursor.
Please note the following.
![]() changes to….
changes to…. ![]()
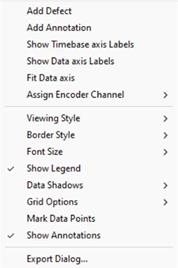
With the Cursor icon set to the dotted line, the right mouse click will move the RED dotted line cursor, with the icon set to Persistence the right mouse button will open the Context Menu, see below.
Context Menus Plane Window
 |
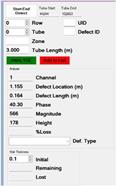
Row, Tube & Zone. If an inspection is open, then these values will be read-only and are set by choosing the current tube within the Inspection window. If no inspection is open, then the user is free to label the tube with these values to match the inspection to enable this tube to be easily identified.
UID & Defect ID. These values cannot be edited by a user. If the Tube Analysis window is editing an existing defect, then these values will be updated to the defect being edited. If this is a new defect, then they will be 0.
Tube Length. This can be edited by the user to show the length of the Tube being tested, or more precisely the length of the tube between the Start and Stop cursors. This is used to estimate the location of any defect located.
ANALYSE. If there is a Calibration Curve present then clicking this button will use that curve along with required parameter (Angle, Magnitude, Height) to give a %Loss value.
Save / Editing. / Add to List. This is the same button. If an existing defect has been double-clicked in the Defect List, then the button displays Editing… and is purple, once a parameter is changed the button changes back to Save. When clicking Save, an existing defect is updated with the modified parameters. Add to List will add this new defect to the Defect List.
Channel, Phase, Magnitude, Height – These values are populated from the data in the main tool bar.
Defect Location is populated if the Tube Length, Tube Start and Tube End boxes contain values. It is the estimated location of the defect form the Tube Start cursor.
Defect Length will be populated with Defect Location but is dependent on the size of the pink Persistence are on the Strip Charts.
% Loss is populated when the ANALYSE button is clicked (see ANALYSE above). If there is no Calibration Curve, then this value is left blank.
Defect Type can be chosen by the user and shows a list of the predefined defect types. When clicking ANALYSE the phase angle is used to identify if this defect is an Internal or External defect. Among the defect types are also types that are NOT actual defects but indicate other options or labels that can be applied to a tube, i.e., OK (if all is well) and for example BLOCKED (if a tube could not be tested).
The final Wall Thickness area is for information only and the data is not stored. By entering an Initial wall thickness the Remaining and Lost
wall thickness is calculated from the % Loss value when ANALYSE is used.
The process of simply analysing data from a single pull of an ID probe is only half of the process for many. The full process often includes assigning the results to a defined tube map, producing a defect report, saving images and data that can be archived and easily restored, compiling statistics on defect types, and identifying the next tube to be scanned.
If ETherMap is being used in conjunction with the TMR software and ETherMap software was opened from TMR, then it will have automatically opened an Inspection Plan. Alternatively, an Inspection Plan can be created or a previous one opened. Please see the Inspection Plan section within Side Windows starting on Page 41.
To analyse data, you must have created appropriate sizing curves and clicked on commit. Once you have committed to a single or several sizing curves, the analysis system will calculate ID & OD wall loss accordingly.
If you have an Inspection Plan and a Session ready, you can start acquiring the tube data. After each acquisition of the tube data, you can analyse the data and record and save the results to a CSV file report. If you are using the TMR software, the CSV report file will be used and referenced in the associated TMR report. If you are using only the EtherMap software a CSV report file will be created which can be converted into an Excel file, for detailed instructions, see the Defect List Section, starting on Page 65.
Once you have selected the tube coordinate from the tube list that has been created, you can the click the Square Green Live or Analysis button to start streaming data.
![]() Live or Analysis
button, which is found on the far lefthand side of the Main Toolbar.
Live or Analysis
button, which is found on the far lefthand side of the Main Toolbar.
The probe would usually be inside the tube at this point and all charts would be balanced, either individually or simultaneously by clicking on the appropriate balance button.
![]() Balance All Charts button
Balance All Charts button ![]() Balance an Individual Chart Button. N.B. Both buttons
sit side-by-side on the Analysis
Toolbar. The record button would activate, and the probe would normally
be pulled through the tube, until it exits at the end of the tube.
Balance an Individual Chart Button. N.B. Both buttons
sit side-by-side on the Analysis
Toolbar. The record button would activate, and the probe would normally
be pulled through the tube, until it exits at the end of the tube.
![]() Start Recording
button which is found on the Main Toolbar.
Start Recording
button which is found on the Main Toolbar.
If the data tube doesn’t record any notable discontinuities and/or defects the operator can elect to click on the Tube Okay/No Defects Detected button, and the system would then select the next tube coordinator so that data could be acquired.
![]() Short Cut Analysis
“Tube is Okay” – “No Defects Detected”
button, which is found on the far righthand side of the Analysis Toolbar.
Short Cut Analysis
“Tube is Okay” – “No Defects Detected”
button, which is found on the far righthand side of the Analysis Toolbar.
If there are defect signals, the operator can elect to add in the start and end point dotted line cursors and then measure each defect by covering the signal with the Pink Persistence bar and measuring the wall loss by utilising the Defect Analysis System. (See Images and notes below for reference)
 |
For detailed information regarding Tube Start & End dotted line cursors go to Page 53.
![]() Tube Analysis button, which is found on the Analysis Toolbar,
and when clicked
will display the tube Analysis
window in the Side-
Window.
Tube Analysis button, which is found on the Analysis Toolbar,
and when clicked
will display the tube Analysis
window in the Side-
Window.
 |
 |
||
Once the data has been analysed, the next tube can be inspected and analysed.
Repeat the above until the end of the session and/or the tube bundle has been completed and there are no more tubes to inspect. Make sure the Finish button is clicked at the end of each session and/or at the end of the inspection.
As stated above, the live data display should be activated using the GREEN square and enough windows should be open in the Display Area to show all desired channels. If the data is looking as expected, then it’s time to begin recording individual inspections.
When ready to begin recording click the GREEN Octagon to begin, the icon will change to a STOP sign, which should be clicked once the single inspection has been performed.
The icon will now change to a floppy disk icon. At this point the data can be analysed, saved (by clicking on the disk icon) or discarded by simply clicking once more on the GREEN square where live data will resume.
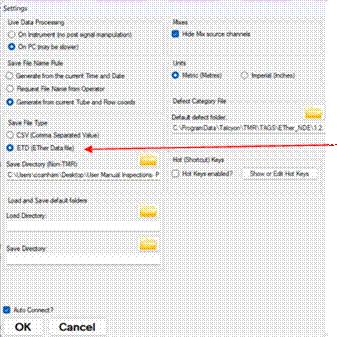
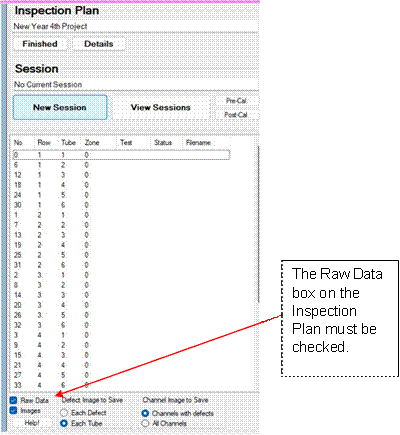
When collecting data to be viewed and/or analysed later you must make sure the ETD (Ether Data file), found in the Settings Window, and the Raw Data tick box, found in the Inspection Plan Side Window, have been checked.
 |
 |
 |
|||
When analysing previously acquired data that is part of a project you must load the project into EtherMap and then click on each datafile to view and analyse the data.
Follow the steps below to view and analyse the tube inspection data.
Step-1:
![]() Click on the Show Inspection Window Icon, found
on the Analysis Toolbar, to open the Inspection Plan in the Side Window.
Click on the Show Inspection Window Icon, found
on the Analysis Toolbar, to open the Inspection Plan in the Side Window.
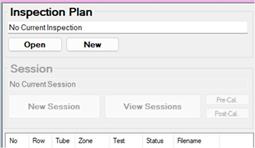
Step-2: Click the Open button on the Inspection Plan Window. This will open a Browse For Folder window.
 |
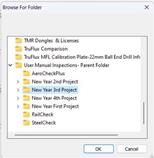 Step-3: Navigate to the project folder
you require, through
the Browse For Folder window and click OK.
Step-4:
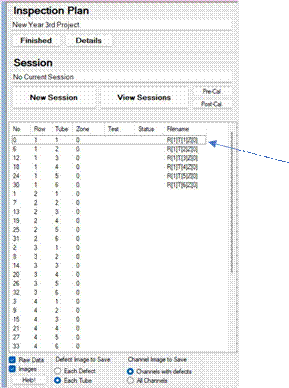
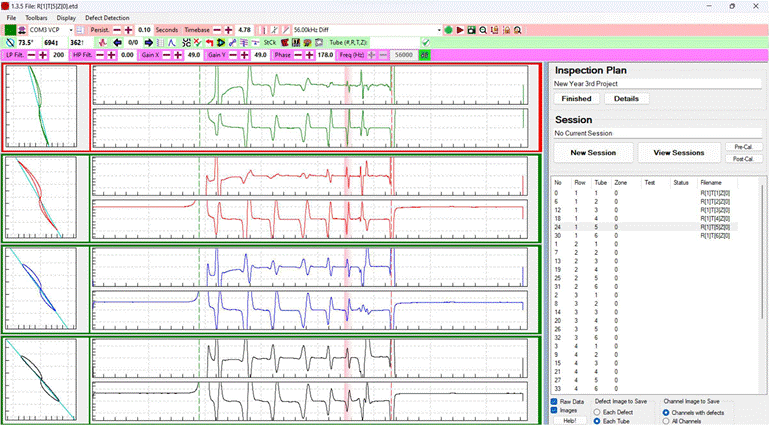
The tube list will appear in the Inspection Plan window which will show which tubes have been inspected.
 |
 |
||
Step-5: Click on each tube coordinate file name to view the acquired tube inspection data.
 |
Step-6: ![]() Click on the Analysis
button and analyse
the data accordingly. For more detailed
information, see the sectioned titled
Acquiring & Analysing
Live Tube Data with EtherMap starting on Page 56.
Click on the Analysis
button and analyse
the data accordingly. For more detailed
information, see the sectioned titled
Acquiring & Analysing
Live Tube Data with EtherMap starting on Page 56.
Steps-1 to 3: Follow Step 1 to 3 as detailed above
Step-4: ![]() Click on the Show Defect List button,
which is found on the Analysis Toolbar.
Click on the Show Defect List button,
which is found on the Analysis Toolbar.
 |
 |
||
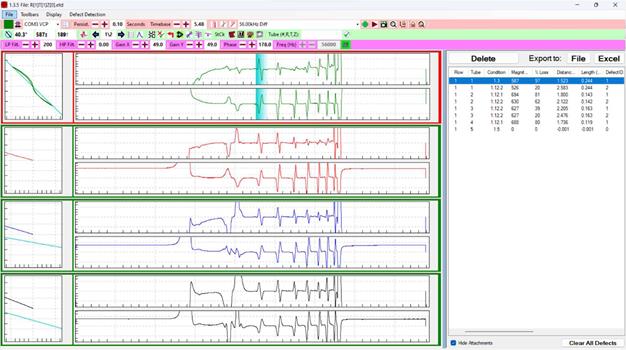
Step-5: Click on each tube coordinate listed to view the acquired tube inspection data.
 |
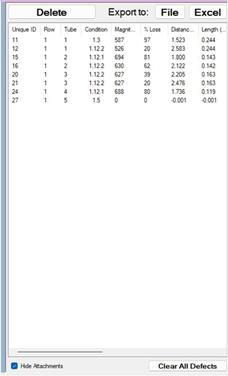
Quite simply a list of all defects within the current inspection. As well as an entry in the table for each defect, there is also an entry for each attachment (file or image) that has been created for each defect (according to the rules at the bottom of the Inspection Plan window).
As there can be many more entries in this table attributed to attachments, there is a check box at the bottom of the window name Hide attach’s
that does precisely that, hides all entries in the table that are NOT actual defects. Below is an example Defect List with the attachments hidden.
 |
The columns in the table in detail:
Unique ID Each entry in the table has a unique identifier.
Row & Tube The location of the tube containing the defect within the tube sheet. Condition The defect label that has been assigned to this defect.
Magnitude If the defect was identified on the Phase Plane when logged, it may have an associated Magnitude.
% Loss A value of % Loss may have been identified automatically with the use of a Calibration Curve.
Distance If a Tubes start, Tube End and Tube length values were present on the Tube Analysis window then the distance of the defect from the start of the tube is displayed.
Length This is the Length of the defect. This is NOT calculated but is taken from the Persistence value (Thickness of the pink highlight on the Strip Charts).
Defect ID If there is more than 1 defect on a tube, the number increments. All attachments will have the Defect ID of the defect that they are from.
Zone The Zone value of the tube under test.
Start & End Physical sample numbers of the Start position and Start + Length position of a defect. Channel Which Channel of Eddy Current data was the defect identified on?
Attachments If the entry IS an attachment, then this shows the filename of the attachment within the Session folder. Tube ID The unique ID of the tube.
Tube Length If there was a Tube length value in the Tube Analysis window, it is added here. Session ID Each defect is logged during a Session, this is the number of that Session.
We also have 3 buttons below the Defect List. Clear simply clears the whole table of defects. The other 2 buttons generate what will be the main output from ETherMap, a manageable list of defects. If the computer running ETherMap has Microsoft Excel installed, then clicking Open in Excel will open this application and populate a table with the Defect List table. Otherwise, the button Export to File will allow the table to be saved in CSV (Comma Separated Value) text file.
If using ETherMap with TMR, there is no need to export the data, it will be automatically imported to TMR.
Safety: Even classified as lithium-ion batteries UN3480 or UN3481 (Contained in Equipment or Packed with Equipment), the product is handled as Non-Dangerous Goods by meeting the UN Recommendations on the Transportation of Dangerous Goods Model Regulations Special Provision SP188 and IATA Dangerous Goods Regulations Packing Instruction 965-967 General Requirement and SectionⅡ(Excepted) is applied for air transportation, IMDG Code SP188 is applied for marine transportation. Battery has passed the UN T1-T8 tests and may be shipped as excepted from these regulations. Battery MSDS sheet available on request.
 EC Declaration of Conformity - this product
is CE marked; CE marking
signifies that the product conforms with all EU
directives or EU regulations that apply to it.
 Environmental Protection: This product should
not be disposed of with household
waste. Please recycle where facilities exist. Check with your local Authority or retailer for recycling
advice.
We EtherNDE Ltd of
ETher NDE Ltd. Endeavour House,
Unit 18, Brick Knoll Park, Ashley Road,
St Albans, Hertfordshire, AL1 5UG
United Kingdom
Hereby declare that:
Equipment: ETi-300 Eddy Current Flaw Detector, Model Number: IETI300
Meet the intent of Directive 89/336/EEC for Electromagnetic Compatibility. Compliance tested to:
Test Specification: EN 61326-1:2006
Title: Electrical equipment for measurement, control, and laboratory use.
Test Specification: EN 55011:2009 + A1:2010
Title: Industrial, scientific, and medical (ISM) radio frequency equipment.
- Radio disturbance characteristics
Test Specification: EN61000 Part 4
Title: Electromagnetic compatibility (EMC)
- Part 4. Testing and measurement techniques.
Sections: EN61000-4-2: 2009 - Electrostatic discharge immunity test.
EN61000-4-3: 2006+A2:2010- Radiated radio frequency electromagnetic field immunity test.